

While many reasons exist for this, a simple reality: every single major forecasting institution (both public and private) has consistently, since roughly the turn of the century, under forecast future progress in solar and wind energy. (See after fold for a sampling of the literature on this.) Forecasts have consistently (and often quite significantly) projected much higher costs and much lower deployments than what has occurred in the real world.
While too many simply think of these problems as esoteric ‘energy-geekdom’, these forecasts have real impacts on decision-making in the public and private sectors. One, not very small, example is a big news item this week: General Electric is potentially going to be broken up. One of the key underlying factors behind this might just have been energy forecasts of growing thermal power in the decades to come — forecasts that are turning out to have been wildly off mark. And, GE made significant bets (in acquiring Alstom and Baker-Hughes), apparently, due to senior executives (and Board of Directors) myopically relying on these forecasts without paying attention to the serious critiques about forecasting. (Again, see below for a taste of those criticisms.)
The Institute of Energy Economics, Japan is one of those doing public long-range energy forecasts that can (will) influence public and private investment decision-making. Here is their fall World Energy Outlook 2018. The IEEJ Chairman, Masakazu Toyoda, gave a quite interesting presentation on this study at the Center for Strategic and International Studies. Within the study and in the presentation, many worthwhile takeaways and insights.
As an example of a perhaps self-evident item that too many simply ignore but which Toyoda made quite clear in his presentation: it’s China and India, stupid. Writ large, over the next 35 years, China will add the equivalent of US energy demand to its power sector and India will add the equivalent of an European Union. Want to understand (and, inherently, influence) what will happen globally, in terms of energy demand and supply (including carbon implications), these are the two places meriting the most focus.
Forecasts are useful for helping frame understanding for the future and to help shape decision-making — not through the specific forecasted numbers, but about the potential implications from differences and commonalities across scenarios in terms of investment requirements, policy options, and otherwise. As per above, however, a consistent pattern of significantly under-forecasting renewable energy has had serious real-world impact and continuation of pessimistic forecasting against clean energy options will likely to continue to create problems.

IEEJ 2018 Scenario parameters (Institute for Energy Economics Japan)
The IEEJ forecast has three core scenarios. A reference (base-line), a peak oil demand (think electrification with electric vehicles), and an advanced technologies (investment to address climate change). To the right is a slide (from another presentation) that appeared in CSIS talk that lays out some of the high-level assumptions for each scenario.
Focusing solely on solar,
- The “reference” case has 0.2 to 1.5 terrawatts (TW) of solar PV capacity deployed from 2015 to 2050.
- The (aggressive) “Advanced Technologies” case has 2.5TW.
That does seem like a significant, even aggressive, jump from that baseline (what will occur if we don’t do things differently) and to the advanced technologies (there is a dedicated aggressive effort to invest to address climate change) scenarios.
What is actually happening, however, in the world and what are others projecting:
- In 2017, according to Bloomberg New Energy Finance (BNEF), there was 98 gigawatts (GW) of solar deployments with “a minimum” of 107GW projected for 2018.
- (Note: this post is aggregating, for simplicity, all solar deployment with a comparison against PV. A large-scale forecast, like IEEJ’s, that is aggregating ‘clean’ should have ‘all solar’ in electricity generation (e.g., including CST plants) and not ‘just’ photovoltaic in its scenario assumptions.)
- In 2016, according to IEA, solar accounted for 43 percent of global net additional electricity generation capacity, the majority in 2017, and those trends will continue.
- Solar (and wind) prices are plummeting so much, according to IRENA, that they will be at the low end OR below fossil prices by 2020.
- Actual contract offerings of solar are showing this trend. Just released Colorado bids for solar PLUS storage were far below the offered prices for coal and, in fact, are below the prices of electricity from already existing coal-fired plants.
Assuming that there will be zero growth year-to-year in solar deployments (which is a laughably bad assumption for any planner), 33 years of solar deployments at the BNEF ‘minimum’ projection for 2018 (107GW) would give a total additional deployment by 2050 of 3531GWs (3.5TW) or 1TW more than IEEJ’s aggressive Advanced Technologies forecasting scenario (which, btw, went from 2015 to 2050: adding 2015-2017 adds more than 200GWs to this simple comparative calculation).*
A simple question (okay, not so simple to answer) asked of Toyoda at CSIS with that background as to actual solar deployments versus IEEJ’s projection:
Considering (a) how forecasting has been so uniformly pessimistic about renewable technology and (b) the significant implications of erroneous forecasts, did IEEJ consider doing an actually aggressive solar/wind forecast.
In response to the question and in conversation after the session, the answer might be summarized two-fold:
- solar is really complicated and not uniform across the globe (yes),
- perhaps that is a good idea to consider.
Trying to forecast such a dynamic arena as solar pv deployment is not easy, with the challenges of trying to understand/model innovation (technological, business), policy priorities and change, financial issues (global economic situation, financing costs, …), social priorities, etc … It seems clear, on the face of it, that IEEJ’s ‘aggressive’ solar forecast radically understates what a reasonable “aggressive” scenario would look like. To understand what an ‘aggressive’ forecast re 2050 deployment might look like, here are four (very simplistic approach) examples:
- Indefinite growth at 10 percent per year from 2018 through 2050
- Indefinite growth at 5%/yr
- 10%/yr growth through 2027, 5%/yr 2028-2037, 2.5%/yr 2038-2050
- 5%/yr through 2027, 2.5%/yr 2028-2037, 1.25%/yr 2038-2050
By the way, before anyone might consider 2017-2018 potential growth an anomaly, a 10 percent year-to-year change is dramatically lower than what has been occurring with a compounded annual PV deployment growth rate (CAGR) of about 30% in the 2010s and above 40% in the decade before.
What, in terms of additional solar capacity, results from the above simplistic assumptions for feeding into a forecasting scenario:
- 10%/yr = 23.8TW of additional solar capacity by 2050
- 5%/yr = 8.6TW
- 10% and then slowing: 11.4TW
- 5% and then slowing: 6.3TW
There is a radical difference between 6.3TW-23.8TW and 2.5TW for use in an ‘aggressive’ forecast scenario (and, well, 0.2-1.5TW in a baseline scenario) to help understand options moving forward and to help drive energy forecasting.
Due to the range of problems with the above (assumes zero retirements over time and just additions to the total solar capacity, doesn’t account for any questions of materials supplies, doesn’t discuss other energy systems, isn’t placed against likely world total energy demands (with expansion from 2014 total grid-connected electricity capacity (roughly 6.5TW)), etc, etc, etc …), these aren’t hard figures to include into a forecast. On the other hand, this approach provides a framing to understand that the IEEJ ‘aggressive forecast’ might be an order-of-magnitude (or more) below what a plausible “solar-heavy” future could look like.
Analysts and analysis are there to provide a framework for and to assist decision-makers have the potential for making better decisions. Even the best analysis can’t survive a bad decision-maker. On the other hand, it takes an exceptional decision-maker to make optimum decisions when provided faulty analysis.
When it comes to clean energy, energy forecasting has consistently provided decision-makers (not all of who are exceptional) faulty analysis. From the EIA to IEA to IEEJ to …, the world’s energy analysts owe decision-makers far better when it comes to forecasting plausible clean-energy futures.
NOTE:
There is a rich body of literature discussing how forecasting of renewable energy has quite consistently fallen short of actual paths forward. Here is a sampling of that literature:
- Richard Martin, For 2018, EIA looks to get renewables right, SNL
- Dan Cohan
- Lowell Feld
- EIA Renewable Energy Forecast Isn’t Just Wrong, It’s Wildly, Laughably Too Low
- Why Energy Forecasting Goes Wildly Wrong, (co-author), Journal of Energy Security
- EIA’s Response to Criticisms of Its Clean Energy Forecasts Fails to Address Core Concerns, Tigercomm
- David Roberts, The International Energy Agency consistently underestimates wind and solar power. Why?, Vox
- Auke Hoekstra, Photovoltaic growth: reality versus projections of the International Energy Agency
- Roger H. Bezdek1 and Robert M. Wendling, A Half Century of Long-Range Energy Forecasts: Errors Made, Lessons Learned, and Implications for Forecasting (pdf), 2012
- Alexander Gilbert and Bernard Sovacool, Looking the wrong way: Bias, renewable electricity, and energy modelling in the United States, Energy
- Jigar Shah, US Government Finally Responds to Me (and others) on Renewable Energy Data
- Jeff St. John, Why EIA’s Energy Outlook Misses the Real Value of Renewable Energy, Greentech media
- Samatha Page, This Federal Report Underestimates Renewables Every Year, And Energy Experts Have Had Enough, Center for American Progress
- The U.S. Department of Energy?s EIA projections continue to miss the mark, PV Magazine
- Zachary Shahan, IEA Gets Hilariously Slammed For Obsessively Inaccurate Renewable Energy Forecasts, CleanTechnica (leveraging Paul Mainwood’s excellent A modest proposal to the IEA at Quora)
- The Energy Collective
- Get Energy Smart, NOW!
- Buried in @WhiteHouse staff report: Energy Information Administration planning for a 6C future
- Department of Energy’s “Annual Outlook 2015” is out: what do we know w/out reading it?
- .@WhiteHouse makes clear that @EIAgov does lousy fossil fuel forecasting, ignores that its #Solar and #Wind forecasting even worse
To be clear, the forecasting challenges are not (remotely) isolated to “just” forecasting the extent and price of renewable energy into the future. Energy is an interconnected system: underestimate the pace at which efficiency (a la, LED lights) penetrates the market and there is higher growth in electricity demand; lower renewable deployment requires more electricity from other sources; miss the implications of shale gas and coal/nuclear are more important; etc …; …; etc … (Note that complexity with the opening words of the post “many reasons exist …”) So, with that sort of compounding challenge in forecasting, while consistently under forecasting solar and wind growth for the past twenty years, forecasts have been high for coal in the 2010s. Here, for example, is a chart from Carbon Brief showing the IEA projections about coal demand against what actually occurred.
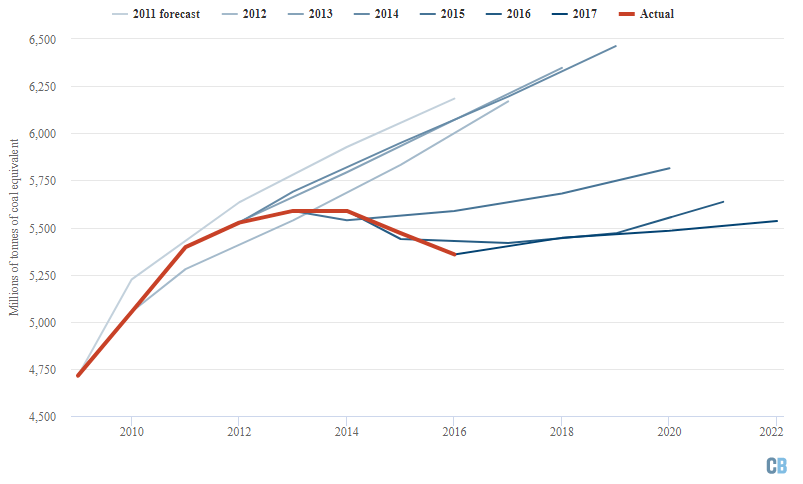
The IEA’s projections for coal demand show growth while actual demand falls (Carbon Brief)
General Electric and others (read Peabody) invested thinking that that rising line somehow reflected reality and actual reality crushed their businesses.
1 response so far ↓
1 New EIA forecast subtitled: We are EFFed … // Feb 6, 2018 at 11:19 am
[…] Outlook has been released and one’s hope, on first glance, is that this forecast is just as off as so much of energy forecasting has been because, if this is accurate, the simplest summary of this might […]