June 24th, 2014 · Comments Off on When it comes to Climate: Inaction costs, Action benefits
Simply put, the economic analysis related to climate change issues in public debates has systematically gotten things wrong. The very nature of the analytical process fosters an exaggerated projection of costs and an understatement of benefits from climate mitigation and adaptation investments. This fosters a discussion of the “costs” of action, rather than a more honest and meaningful discussion of the extent and nature of the “climate mitigation return on investment”. Fully-burdened cost-benefit analysis would highlight the huge return to be secured from sensible climate investments.
When it comes to cost-benefit analysis, two just released reports shed important perspective on this issue:
Risky Businessdocuments the costs the United States is already accruing due to climate change impacts and projects these costs through the century. Costs could include over $500 billion of coastal property below sea level by 2100, outdoor labor productivity declines of over three percent, agricultural production losses that could — in some regions — exceed 50 percent, etc … Writ large, $trillions at risk in the US economy from unchecked climate change.
A simple truth — only dupes and villains can deny that we face very serious risks and consequences from climate change.
The key hope, however, is that we (writ large) still have some potential to control how bad the situation will become and opportunities to seize value streams along the path toward climate change mitigation and adaptation.
That there might be silver linings amid climate change’s looming dark clouds does not create a ‘good’ Anthropocene even as we might seek to find better framing and language than “less catastrophic Anthropocene”.
Responsibility: We face a serious situation. We — collectively and as individuals — are responsible for creating the problem(s) and must take responsibility for helping solve them.
Patriotic Pride: We have solved serious problems in the past and have the capacity to do so moving into the future.
Accountability: While we must recognize that we, individually, have responsibility, there are institutions and people who have much more serious claim to responsibility for creating our problems and for inhibiting action. We must communicate, clearly, who these are and determine ways to hold them to account for their actions.
Within this, a central point is that meaningful and valuable action is possible — that there is a serious difference (for the better) between “business as unusual Anthropocene” and a “less-bad Anthropocne” due to serious climate mitigation and climate adaptation measures.
And, a simple truth underpinning this — we already have valuable opportunities for action and are seeing serious progress.
After the fold is an infographic from The Climate Group laying out “10 smart reasons to invest in a clean revolution”. Putting aside the unmentioned one, that reducing the risks of utterly catastrophic climate change would create an imperative for action anyway, these 10 are interesting to consider.
For example, you have all likely seen the graphics about the drastic reductions in solar prices. Think about this one:
“the cost of LED lighting in the United States has dropped 70 percent since 2009 and deployment has increased by 50x”
It is pretty rare to see CAGR of that enormity for a basic household item. That seems more like fad (Chia pet, anyone) CAGR material.
An acquaintance of mine’s business supports lighting in the building sector. Several years ago, I spoke extensively with him about the value streams of making LEDs central to his business activities. He, not that many years ago, simply did not see a pull from the market for LEDs and — while valuing the learning / discussions — did not see the financial ROI for an LED-focused business strategy. Now? The vast majority of his business is LEDs and, increasingly, other lighting options aren’t even in the discussions with their clients.
Between LEDs and compact fluorescent bulbs, lighting in American households has fallen dramatically as a percentage of home energy use.
And, as a reason for optimism, solar and LED are not oddities in terms of rapid change in the clean energy sector.
Again, see after the fold for an interesting infographic …
June 18th, 2014 · Comments Off on “Believe it or not, it is true”: A musical interlude on climate change (denial)
Communicating on science is difficult in American society. Tackling that communication in the face of concerted efforts to undermine science is an even more difficult challenge.
Effective teachers use a variety of methods to communicate with their students, seeking to find ways to communicate to all of the seven types of learning. For aural, we’re advised to
“use sound, rhyme and music in your learning”.
Those concerned with educating, engaging with, and mobilizing people about climate risks pursue multiple tools, including music such as the catchy song in this video (which is worth watching for some of the embedded graphics). (See after the fold for a second video … )
Aside from a catchy (hmm, recognize it …?) tune, there are many ‘quotables’ within the lyrics.
Before heading further and in line with the Debunking Handbook, let us start with some basic truths about investing in climate mitigation.
Climate mitigation investments will have huge economic returns on that investment ranging from energy efficiency reducing total energy bills to new economic activity surrounding the new technologies and businesses seeking to reduce our climate impact.
Climate mitigation investments will have huge corollary benefits — such as improved human health (from reduced allergy risks to reduced emergency room visits with asthma attacks to reduced deaths due to fossil fuel pollution), improved visibility at national parks, reduced climate impacts on business operations (such as reduced railroad kink risks), increased worker productivity, …
Climate mitigation will reduce the huge risks associated with climate change and will provide an insurance against the potential that climate change implications could be far worse than standard projections suggest (e.g., the risk that the modeling is erring on the too optimistic side).
Climate mitigation is an investment that will provide huge returns — across a spectrum of economic, social, and environmental fronts.
With that in mind, putting aside accusations of skewing the situation to protect incumbents from innovative technologies threatening their business models and to protect polluters from having to take responsibility for the damages their businesses cause, does the past historical record provide us a window on whether we can trust institutions like the U.S. Chamber of Commerce to provide reliable information as to the costs of environmental compliance?
Ramez Naam’s the Infinite Resource: the power of ideas on a finite planet is a powerful discussion of how innovation can enable us, even at this stage, to address climate change successfully. Naam presents a strong version of what I describe as ‘pessimistic optimism’ — he is quite clear as to the extent of our challenges and problems while also providing cogent arguments as to why and how unleashing innovation can enable a transformation of American (and global) society toward a prosperous, climate-friendly future.
Naam has, among other things, an excellent discussion of how opponents and proponents have gotten the cost-benefit equation wrong on past policy discussions of addressing environmental issues (pages 201-204).
Addressing Acid Rain
Industry groups predicted annual costs of $25 billion per year, EPA projected $6 billion per year, over the past 20 years the costs habe been “only $3 billion per year, just one-eight of the industry estimates, and half of what the EPA estimated.”
Benefits: “regulations saved an estimated $118 billion per year in reduced health expenses”.
And … Americans still have electricity for their big-screen TVs.
Ozone layer
“Don Hodel … [Reagan] secretary of the interior after James Watt argued that any near-term risk of thinning ozone layer could be handled by telling people to wear hats and put on more sunscreen. … [DuPont] warned that phasing out CFCs could cost the United States more than $130 billion and “that entire industries could fold.” … the Competitive Enterprise Institute … phasing out CFCs would cost the countgry between $45 billion and $99 billion. … The EPA expected the phase-out to cost a total of $28 billion. …. the actual cost across the entire US economy turned out to be less than $10 billion … less than a tenth of what DuPont had estimated, less than a quarter of the lowest cost estimates from the Competitive Enterprise Institute, and only slightly more than a third of what the EPA itself had estimated.”
While opponents of action had warned that refrigerators would become a thing only multi-millionaires could afford, “the country’s air conditioning and refrigeration kep on working without disruption.”
And …
Benzene: When putting limits on benzene emissions at industrial sites, chemical companies forecast costs of $350,000 per plant. Within a few years, changed processes that eliminated benzene entirely (beating the regulations) reduced this cost to … zero. Health benefits > $billions.
Asbestos: OSHA estimated costs of $150 million to end asbestos use in insulation and the costs turned out to be $75 million. Health benefits > $billions.
Reduced coke oven pollution: EPA estimated costs of $4 billion in 1987 learning by 1991 led to revised cost estimates of $400 million. Health benefits > $billions.
“Everywhere we look, the cost of reducing either resource use or pollution drops through innovation. Even the cost estimates of regulators turn out to be too high.” (205)
Much will (and should be said) about the EPA rules released this morning. (Questions such as … Whether the 2005 starting point is gamesmanship to make the targets look bigger? (Well, yes …) Whether the rules go far enough? (Well, no …) Whether the coal industry is bearing enough of the financial burdens for the damages burning coal causes? (Hmm, absolutely not.) Etc …) But most simply … That the EPA is moving forward with guidance on coal fired plants is — seriously — good. That President Obama and the Administration are demonstrating a willingness to take — in wide public view and in the face of serious political interest pushback — Administration action in the face of a do-nothing Congress is good. That this is a step in the right direction is — without question — good.
What is not good is that, inevitably, the entire discussion will exaggerate the costs of action and understate the benefits of action.
And, well, as to the question above:
Does the past historical record provide us a window on whether we can trust institutions like the U.S. Chamber of Commerce to provide reliable information as to the costs of environmental compliance?
Yes. And, that window says that their predictions should not be trusted.
Figure. Claims that environmental laws will destroy the economy have been regularly made and are consistently false. This graph shows U.S. GDP from 1929 to 2013 in real 2009 dollars (corrected for inflation) along with the years major environmental laws were passed. (Prepared by Peter Gleick, Pacific Institute. GDP data from the US Bureau of Economic Analysis.)
NOTE: Sadly, the word “skeptic” has gotten a rather black eye in recent years as people engaged in outright science denial wrap themselves within the term “skeptic” as they are too often JAQing off (“Just Asking Questions”). Skepticism, however, is a very valuable intellectual trait as long as it is done honestly: prepared to look at and consider evidence and answers with a willingness and ability to adapt one’s thinking in line with reality rather than seeking to have reality conform to your preconceptions and ideologies. While we all (or, well, at least most — I hope) seek to have such internal honesty, this is difficult and many are unable to get past their preset framework to achieve learning from responses.
Knowing that the coal’s damaging impacts on human health, especially on children, isn’t a PR success, the industry has decried that President Obama had the audacity to
The White House release a report yesterday heralding the All of the Above energy policy. Entitled “The All-Of-The-Above Energy Strategy as a Path to Sustainable Economic Growth,” the document seeks to bask in expanded US oil and natural gas production while asserting that policies for energy efficiency and renewable energy are setting the stage for sustainability into the future.
Simply, the declarative U.S. policy can be summarized as targeting global warming as remaining below a two degree centigrade (2C) warming above pre-industrial areas.
Figure 4-1 on page 32 is a reproduction of an EIA chart of energy-related carbon emissions. As with fossil fuels, this graphic shows a dramatic decline in emissions compared to what was forecast. In 2005, as you can see to the right, the EIA forecast essentially a steady upward path for US emissions. 2013 emissions were, in fact, roughly 30 percent lower than what EIA predicted just eight years earlier. And, the 2014 projection is essentially a flatline stability from now into the future.
The baseline path is computed using a combination of historical trends and published forecasts as of 2005. Relative to this baseline, slightly more than half of the decline is due to slower growth than projected in 2005, that is, because of the decline in economic activity as a result of the Great Recession. Slightly less than half the reduction is due to cleaner energy, primarily the reduction in electricity generated by coal and the increase in cleaner natural gas and zero-emissions wind and solar generation. Improvements in energy efficiency made a small contribution: although economy-wide efficiency improved over this period, it improved only slightly faster than the rate projected by the Energy Information Administration in 2005.
The EIA got the ghg emissions path as wrong as it did the fossil fuel projects. However, with all the focus on climate-change issues (and tomorrow’s projected release of EPA carbon rules for power plants), this issue is buried on page 32 without a serious discussion as to the implications.
The 2005 forecast pointed to roughly 8 billion tons of emissions in 2030 while the 2014 projection is for under 5.5. That is good news … perhaps. With the ‘flat line, those energy related emissions are roughly projected to be 5.5 billion metric tons in 2040.
A simple question to ask. Is this anything close to what is required?
The International Energy Agency recently released a report that models what is required globally and within individual countries to meet temperature targets of 2C, 4C, and 6C. There is a very interesting graphical interface that enables looking at the IEA work from a number of angles. Click on the “emissions reductions” and then “United States”, we can then see where the IEA projects the United States has to go as part of a global emissions profile for a 2 degree, 4 degree, or 6 degree centigrade temperature increase. As a reminder, the globally ‘accepted’ target by the international community: 2 degree temperature increase from levels prior to the industrial revolution. From the IEA work, the US emissions have to be below 2B tons by 2040 and down to 1.1 by 2050 for some confidence of a 2 degree path. The EIA’s 5.5B ton emission path? That is right in line with 6 degrees.
At 1 degree Celsius, most coral reefs and many mountain glaciers will be lost. A 3-degree rise would spell the collapse of the Amazon rainforest, disappearance of Greenland’s ice sheet, and the creation of deserts across the Midwestern United States and southern Africa. A 6-degree increase would eliminate most life on Earth, including much of humanity.
And, the EIA’s baseline case projection of US emissions assumes a 6 degree increase. In technical terms, OH SHIT!
Thus, returning to the simple question, a simple answer: No, this is not close to what is required.
The White House staff evidently recognizes this issue. From the report:
This analysis of the recent reduction in emissions shows that while progress has been made, much more remains to be done.
But that is it … no serious acknowledgment that the Department of Energy’s Energy Information Administration’s baseline scenario assumes a 6 degree C future or, as some more expert than I might put it, utterly catastrophic climate chaos.
Should climate catastrophe catastrophe be our baseline scenario?
Shouldn’t this issue merit more serious examination.
NOTE: And, if the EIA’s projections on fossil fuels, renewable energy, and greenhouse gas emissions have proven so off from the past, shouldn’t the Administration take a serious look at why this is the case and what might be possible to either the forecasting structure. In government and industry, the EIA data and forecasts are taken as ‘gospel’ and serve to undermine investment decisions with decades-long implications. If the projections cannot, on a regular basis, be reliably counted on for projections, how can and should we restructure the reporting to better inform decision-making requirements both within government and outside it?
The White House release a report yesterday heralding the All of the Above energy policy. Entitled “The All-Of-The-Above Energy Strategy as a Path to Sustainable Economic Growth,” the document seeks to bask in expanded US oil and natural gas production while asserting that policies for energy efficiency and renewable energy are setting the stage for sustainability into the future.
Weirdly, while spending many pages detailing how the Energy Information Agency (EIA) failed to predict accurately fossil fuel trends, the report’s authors failed to highlight that the real-world performance of renewable energy (notably wind and solar) has greatly outperformed baseline forecasts. With the President’s call for more solar energy, highlighting that renewables have been doing so well (in price reductions and speed of market penetration) would seem something strongly support of Administration objectives rather than for something to be ignored in a 42-page White House report.
Amid its 42 pages, there is one element that has already received much attention: a set of graphics highlighting how poor the Energy Information Administration (EIA) forecasting has been on fossil fuel (natural gas and oil) production and US oil demand. The graphic on net imports is one example (see here, here and here for more) of ‘getting it wrong’. The combination of reduced domestic demand and increased production combined for this dramatic reduction in net imports. The shifts from 2006 are from a mix of policy decisions, technological advances, business developments, economic conditions, and societal change.
Policy decisions have been driving improved efficiency (automobile fuel efficiency standards, building efficiency to reduce oil heating, etc …) along with enabling increased oil production.
Technological improvements in oil extraction (fracking) have increased production while efficiency measures have driven down demand. Efficiency measures are well beyond ‘just’ improved auto fuel efficiency, but also include increased leveraging of information technology to find more efficient routing of transportation (everything from routing UPS trucks to GPS helping individuals avoid traffic) and to even reduce transit requirements.
Business developments fosteringlower demand include the above mentioned efficient management to increased internet sales to …
Poor economic performance drove down demand while continued high global (and US) fuel prices favor conservation, efficiency and substitution.
Societal shifts include increase social interactions over the internet (gaming, otherwise) lowering social driving and delayed/reduced securing of drivers’ licenses.
Thus, there are many reasons for the EIA forecasts to have been off by so much. Truly, energy forecasting is a difficult business (excellent discussion here). Going back decades, such ‘errors’ in forecasting would emerge across the board — with a fluctuating from what might be conceived of as over optimistic to overly pessimistic forecasts. Thus, the material in the White House report as to reality not conforming to forecasting when it comes to fossil fuel production and demand is not at all surprising.
What is absent, however, from the White House report’s extensive discussion of forecasting is a discussion of renewable energy. While there have been problems in EIA forecasting when it comes to fossil fuels, a reasonable evaluation of renewable energy forecasting might term it a ‘horrific’ record. Here is material from a 2013 discussion by Lowell Feld, a former EIA employee, EIA Renewable Energy Forecast Isn’t Just Wrong, It’s Wildly, Laughably Too Low:
In 2005, EIA forecast that U.S. solar power capacity would hit about 1.2 GW in 2013. Where are we right now? According to Greentech Media, the U.S. is closing in (if it already hasn’t passed) the 10 GW mark in solar PV capacity right about now, and that’s not even counting solar thermal power generating capacity (according to this article, you can add another 1 GW or so of U.S. solar thermal power capacity). In sum, EIA forecast 1.2 GW of U.S. solar power capacity in 2013; the actual figure is around 11 GW – nearly 10 times higher than EIA forecast!
In 2005, EIA forecast that U.S. wind power capacity would reach about 9 gigawatts (GW) in 2013. Where, in fact, are we right now? According to theAmerican Wind Energy Association (AWEA), installed U.S. wind power capacity at the end of 2012 was 60 GW. Quick math: EIA’s forecast of 9 GW compared to an actual 60 GW? That’s off by a factor of nearly 7!
We could go on and on with this, but you get the picture: EIA has basically ZERO ability to forecast long-term energy trends even close to correctly.Let me emphasize: it’s not that EIA is off by a just a bit; they’re off by orders of magnitude.In that context, let’s look at their latest long-term “forecasts” for renewable energy.
According to Table A16 (“Renewable energy generating capacity and generation”) in EIA’s latest long-term forecast, the agency expects wind power generation capacity to increase from 59 GW in 2012 to 76 GW in 2020 and 85 GW in 2040. That may seem like a lot, but it’s only an increase of 26 GW over the next 27 years or so. To put it another way, that’s about 1 GW of additional wind power per year through 2040, or total growth of just 44% during those 27 years. Put it this way: EIA must know something that billionaire investor Warren Buffett, who just ordered more than 1 GW of wind turbines (at a cost of $1 billion) doesn’t know. I’d also note that U.S. wind power generating capacity grew 33-fold over the past 15 years (from 1.78 GW in 1997 to 59 GW in 2012). Just between 2007 and 2012, U.S. wind power generating capacity grew nearly four-fold (from 16 GW to 59 GW). Yet we’re supposed to believe that U.S. wind power generating capacity will grow by only 44% over the next 27 years? If you believe that…well, I’ve got a nice, brand-spanking-new coal-fired power plant to sell you! LOL
As for U.S. solar power (including solar PV and solar thermal), EIA forecasts that it will reach about 66 GW in 2040, compared to about 10 GW in 2012. That seems like impressive growth (a 6-fold increase over the next 27 years), except when you consider that solar has grown from just 0.35 GW in 1997 — a 28 fold increase over the past 15 years. I’d also point to the latest Greentech Media short-term forecast for U.S. solar PV installation, which indicates a rapid acceleration in solar PV additions over the next few years (4+ GW in 2013, 5.5 GW in 2014, nearly 8 GW in 2015, and over 9 GW in 2016). That growth alone adds up to nearly 27 GW of solar, just by 2016, with the growth curve accelerating upwards.
Again, the United States is already at nearly 15 GW of solar. And, if the first quarter solar pv installations (without even the concentrating solar projects) continue on pace through the year (even though it is on a rapid acceleration path), the United States will see about 5.4 gigawatts of PV installations or over 30% more than what Greentech predicted just 18 months ago.
Earlier this year, a group of CleanTechnica readers worked together to prepare/send a serious letter to Ernest Moniz, Secretary of Energy, about this. The (well worth reading) letter’s url title horrible EIA forecasts:
the EIA has made thousands of forecasts in the past which never seem to be publicly visited again, for example in the 2010 AEO it was forecast that we would reach 0.45 GW of solar PV on the grid by 2035, in November 2013 we reached 7.11 GW according to the FERC.
PV Solar installations stop in 2016 and do not resume for 12 years and even then at a rate significantly below current rates.
Surely, in making new predictions it would be appropriate for the EIA to address how their models could produce a 25 year forecast which has already been surpassed 16 times over in less than 3 years.
Again, energy forecasting is a difficult business.
The White House is right — EIA got it wrong (for lots of reasons) when it came to forecasting polluting energy’s future path.
However, EIA has been (very consistently) getting it wrong to a much greater extent and in a consistently negative way when it comes to valuing energy efficiency and renewable energy (EE/RE).
If the White House report were truly about a “sustainable economic growth,” then the EE/RE problems merited highlighting and serious discussion as well.
May 27th, 2014 · Comments Off on Sarah Palin likely can see smoke from her porch. Does she understand that where there’s smoke, there’s likely climate change fire?
What are we to make of this fire? After all, fires occur in nature and Alaska has had its share in the past. As Larry Lazar put it in an email to me,
While the size of the fire on Alaska’s Kenai Peninsula is not particularly unusual, it is very early in the season. This type of fire usually occurs from July-September, not May. With the lack of snow last “winter” and the very dry spring (no rain in ~month), this fire was just a matter of time. I wonder what the rest of the summer will be like?
Whenever I read about these large and out of season forest fires, I can’t help but think of what it will be like in 30-50 years or longer. So much for Alaska being a climate refuge.
As for that comment, about “climate refuge”, the reality is that nowhere will be spared the climate chaos’ impacts in terms of an ability to maintain modern human civilization. Even if an area might be (relatively) somewhat unscathed by direct impacts, catastrophic climate change will reduce the global economy’s ability to deliver up everything from sophisticated electronics to pasta. (As to that last, the occasional tv watching a few years ago had me flipped the channels to a discussion of the global industrial machine behind delivering a box of pasta to the supermarket counter. Rather daunting the system-of-systems involved from the farms to the industrial machines for processing pasta to the international transport/logistics system.)
In any event, what is notable is not ‘an’ unusual weather event (earlier large Alaska fire than typically occurs), but how this is part and parcel of an increasing reality of ‘unusual’ weather incidents. Just a few from recent weeks …
Hurricane Amanda: Strongest May eastern Pacific hurricane in human records.
California wild fires: “It is pretty amazing to see these in May,” said San Diego Fire Chief Javier Mainar. “We certainly have seen climate change and the impact of climate change. My understanding from Cal Fire is that we’ve seen twice the number of wildfire starts in the state of California as we typically see this time of year.”
Balkan floods: Not only did this massive flooding displace large numbers of people, cause economic damage, and create opportunities for dramatic photos (like animals being fed on rooftops), it created yet another new climate change impact: uncovering of 10,000s of land mines from the wars of the Yugoslavia breakup (mainly Bosnia but also Kosovo) with new risks for the population as ‘identified’ minefields are now scattered through the countryside.
And …
Of course, the limitations of attribution — the incredible complexity of weather and climate modeling and analysis — make it essentially impossible to assert that any of these events was “entirely caused” by climate change and the warming planetary system. Yet, the scientific community has increased its capacity to attribute climate change impacts on severe weather situations with confidence. And, rather simply, these — and innumerable other — atypical (500 year and otherwise) weather events are all occurring within the context of climate change.
Unlike Russia, Sarah Palin likely could to see the smoke from the Kenai Peninsula wildfire from a Wasilla porch. Even as Alaska experiences a significant warming climate, with dramatic effects on Alaska and Alaskans (including curtailing Todd “My Guy” Palin‘s hobby), it seems even more likely that Sarah Palin will not be able to recognize how that smoke is signaling mounting climate change impacts.
Photo credit: Dan Logan (note, photo is from 2010, not the current Kenai Peninsula fire) and NASA of
Comments Off on Sarah Palin likely can see smoke from her porch. Does she understand that where there’s smoke, there’s likely climate change fire?Tags:climate change
Kahn discussed three drivers for India’s agricultural technology startup revolution:
Demand Growing: With increasing wealth, India’s diet is changing — more fruits, vegetables, and meats. This trend will continue in India and throughout Asia.
Supply Constraints: India’s agricultural supply is tight and will worsen under business as usual. There are “multiple bottlenecks” limiting food production.
Land is disappearing (urbanization) and degrading.
Water quality and supply is worsening.
Labor costs are skyrocketing.
Ecosystem is right:
Human capital of IT, biotech, pharma, etc; technical & managerial talent base.
Research capital with many universities and research institutions with relevant people and programs.
Business base and examples as India has a strong domestic agribusiness built up supporting small Indian farmers and
Moving past this, Kahn explained why he sees India as the best laboratory for small-scale agriculture:
The Indian sub-continent has every single agricultural climate zone found around the world.
Indian farming is small — there are not the large farms that dominate Iowa, Russia, and Australia.
India’s challenges are the global small-holder challenges: limited capital (frugal and durable engineering), small-scale mechanization and lean information technology.
The Indian market is large, big enough to sustain development of new technologies and innovative approaches to then export around the world.
These coalesce to make India unique. Unlike India, for example, China has not built up a branded agricultural export industry and, as Kahn put it gently in an interview, “Chinese internal agriculture is shit.” Other small-holder dominated nations do not have India’s human-capital base. Thus, for true innovation in small-scale farming technology, we should look to and invest in India.
Kahn provided these six key characteristics for Ag 3.0 at play in India and with relevance globally for small-scale farming:
Precision Agriculture
Information Services
Mechanization & Automation
Sustainable Inputs
Supply chain modernization:
Innovative food products:
Kahn’s presentation simply made sense — it clicked as a logical way to look at the situation, opening my (and others’) eyes as to how to look at a path forward for agriculture in the 21st century.
And, amid valid and serious reasons for concerns over mounting climate chaos, Kahn laid a plausible case to see why, rather than starve, India will innovate to take a leading position in creating the Agriculture 3.0 revolution.


 documents the costs the United States is already accruing due to climate change impacts and projects these costs through the century. Costs could include over $500 billion of coastal property below sea level by 2100, outdoor labor productivity declines of over three percent, agricultural production losses that could — in some regions — exceed 50 percent, etc … Writ large, $trillions at risk in the US economy from unchecked climate change.
 discussion of how opponents and proponents have gotten the cost-benefit equation wrong on past policy discussions of addressing environmental issues (pages 201-204).
 a two degree centigrade (2C) warming above pre-industrial areas.
 on net imports is one example (see
  otherwise) lowering social driving and delayed/reduced securing of drivers’ licenses.
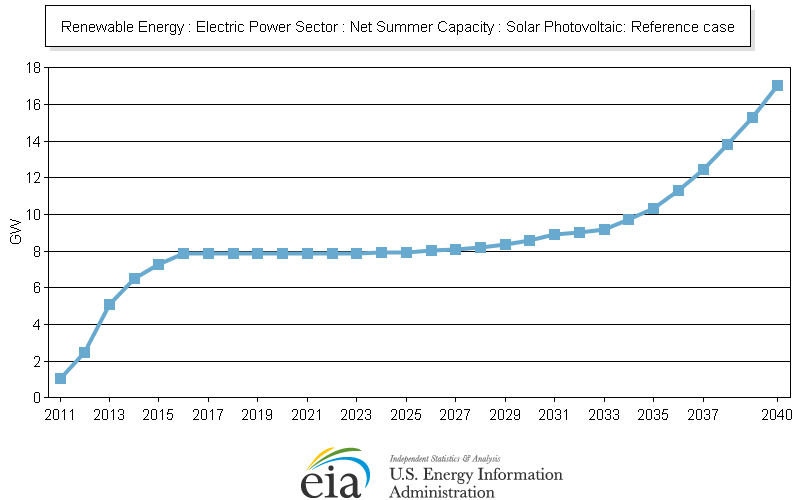

 make it essentially impossible to assert that any of these events was “entirely caused” by climate change and the warming planetary system. Yet,
 lly for small-scale farming: