

This guest post from alefnot is a useful look at the climate change science.
The EPA recently announced that greenhouse gases pose a threat to health and welfare through their role in climate change. Climate change is a complex, nebulous thing that we seem to find difficult to attribute to anything tangible. So what is climate, this thing that is threatening to change in a way that can end society as we know it and possibly worse? There are a number of answers, depending on the nature of the question: “Climate is what you expect, weather is what you get”. Climate is the mean state of the atmosphere. It is the time-averaged temperature and humidity of a region. This last answer provides the key, for both temperature and humidity are related to energy.
So let’s take a step back and look at the big picture: climate is a manifestation of the energy budget at the surface of the Earth. Climate change is the variation of that energy budget.
The surface of the Earth takes in energy, and it also loses energy (it radiates out to space). Temperature stability is achieved when energy in = energy out. If energy in > energy out, the Earth’s surface will warm; if energy in < energy out, it will cool. The details are important here, and those details are found in the energy budget, which is concerned with
- the magnitude of the sources
- how the energy gets from the source to the Earth
- how much is retained at the surface.
Note that all of these are important, and that each changes on its own timescale. Some of these factors may be more important than others at a given point in time; others of these factors may be more important at another point in time. Some factors are more important than others on one timescale but less on another.
Energy sources:
There are two of any consequence, the Earth itself provides a planetary heat flux, and a raging nuclear fireball 150 million km away we call the Sun. Solar energy falling on the Earth is known as insolation. Solar insolation provides far more energy than the Earth heat source.
Planetary Heat Flux
The temperature at the Earth’s core is not well known, as we cannot measure it directly, but is thought to be at least 4000K (at the boundary with the mantle) and less than 8000K. We occasionally see molten rock spewing out of exploding mountains so we know the interior is hot. But the Earth’s crust is a good insulator, and except for the odd volcano the heat flux from the interior of the Earth to the surface is surprisingly small. This too is difficult to measure and suffers from severe sampling bias (lots of measurements in the US and Europe, very few in the remote Pacific), but most estimates have it between 50 and 100 mW/m2 (milliwatts per square meter: flux is something per unit time per unit area, so an energy flux has units of energy/(time area) = power/area) in the mean. The estimate of Pollack et al. (Rev. Geophys., 31, 1993) of 87 mW/m^2 is typical. The heat flux is not uniform: here’s a figure from Shapiro and Rollwitz, Earth Plan. Sci. Lett., 2004.

Note that the large variations in Antarctica are not reflected in the surface temperatures. This is because the planetary heat flux is tiny compared to solar insolation and the rate of radiative cooling out to space. As a direct heat source we can ignore it, although it does indirectly exert a control on very long (10M – 100M year) timescales through atmospheric composition, albedo, and ocean circulation. The first is due to the burial and uplift of reduced carbon and sulfur, the other two from moving tectonic plates around.
Solar insolation
At the top of the atmosphere (TOA) we get about 1366 W/m2 from the Sun. This is known as the solar constant, and is only approximate because the solar constant is not actually constant. This varies on a huge range of timescales, raging from very short term fluctuations to an 11 year sunspot cycle to the billion year timescale of stellar evolution. Today we have excellent satellite data of the solar constant — this figure from NASA shows that we are near if not at a minimum in the 11 year solar output cycle (high sunspot number = high solar output, low sunspot number – low solar output). The next peak in solar output is expected to take place in 2012-2013, although the Sun appears to be defying that prediction and output remains lower than expected.

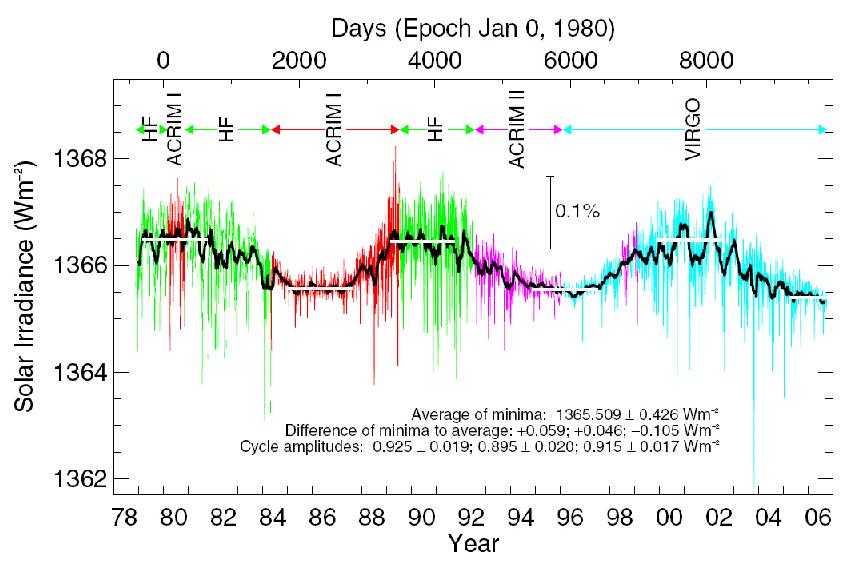
Note that there is a slight decrease in the mean output over the last 30 years or so. That follows a general increase over the first half of the 20th century (reconstruction by Lean et al, 1995):

The 1366 W/m2 is TOA: at the surface, on a clear summer day in lowish to middle latitudes around solar noon we get a bit more than 1000 W/m^2. Of course this is lower in winter, at higher latitudes, in cloudy conditions, and goes to zero at night. Globally averaged over day, latitude, season, we get about 180 W/m2, or 2000 times that from the Earth (image from the Encyclopedia of Earth).

Essentially all of the direct heat input to the surface of the Earth is from the Sun. However, it does not follow that solar variability is always the primary driver of climate variability or even the current primary driver (though it has been more significant in the past, such as during the Maunder minimum in the so called “Little Ice Age”, and no doubt it will again in the future): if that were true, the global temperature record for the last 30 years would be controlled by the solar term for the last 30 years (see figure above), which is obviously not the case (figure from newscientist.com using data from NASA GISS):

In fact, while the solar variability term always contributes to climate variability, it is not generally the controlling term.
There is also a v e r y long timescale variation as well: like all stars, the Sun evolves, and the young Sun put out perhaps 70% of the energy it does today (that there was liquid water then is most likely due to more of what energy reached the Earth being retained in the Earth surface by greenhouse gases). Eventually it will blow up into a red giant, then collapse into a white dwarf. Both of which will have severe implications for Earth’s climate.
Sun to Earth
Except extremely locally around hydrothermal vents or volcanoes the planetary heat source provides an insignificant direct forcing, so we’ll ignore it from here on in. The Sun is, of course, 150 million km away, so how solar energy gets from there to here is also important.
The Earth moves in an elliptical orbit around the sun. It rotates, and its axis of rotation today is tilted 23.5o from the orbital plane (the ecliptic). But its orbit is not quite regular: the ellipticity varies with time, sometimes more elliptical, sometimes less, and it varies on a timescale of about 100000 years. Nor is its axis of rotation fixed — it “precesses“. That is, today the axis at one end points roughly to Polaris, in the constellation Ursa Minor (the other end doesn’t point to anything obvious); however in 2000 years it will be in the constellation Cepheus, in 10000 years in Cygnus, in 25800 years back to Polaris, as the axis of rotation precesses about the North Ecliptic Pole (the perpendicular to the orbital plane in the northward direction), which is actually in Draco — the South EP is in Dorado. Finally, the tilt from the ecliptic, or “obliquity“, varies from about 21.5o to 24.5o on a timescale of about 41000 years. Actually, since the Earth is affected by the gravitational potentials of other planets, there are other periodic signatures, the strongest at 19000 years, 71000 years, and 400000 years. So the Earth does not orbit the Sun in a pure Platonic orbit — there’s a lot of jigging and bouncing around out there.
One more thing. A light source directly overhead delivering 1 Watt over one square meter delivers 1/2 W/m2 over 2 m2 if it’s tilted at 60o from the vertical (the “solar zenith angle” for the sun; you can also think of the “solar elevation angle” above the horizon if you want, but most people use SZA). The sun is a lot stronger in Cairo than it is in Dublin because it is more nearly overhead. Summers are hotter than winters because the sun is more nearly overhead in summer.
Clearly changes in eccentricity affect solar insolation. Obliquity is a little less obvious. When obliquity is low, the difference between summer and winter temperatures is less because of the smaller range in SZA, and cooler summers mean less ice melt, which generally means more glaciation. Precession determines when summer and winter occur: right now the Northern hemisphere summer occurs near aphelion (Earth’s farthest point, happens on July 4 this year. Earth was closest to the sun — at perihelion — this past January 4). The combination of all these periodic variations in the Earth-Sun distance (eccentricity) and Earth-Sun angle (obliquity and precession) affects the amount of solar energy that reaches the Earth. This behavior is known as Milankovitch cycles, after Milutin Milankovitch, the first guy who worked through the orbital calculations. Here’s a figure from Russ Joesten of the University of Connecticut showing the net effect:

Here “tilt” refers to obliquity. The right-most plot is a proxy for global temperature. The correlation between solar insolation and temperature strongly indicates that orbital variability is the primary climate driver on the 104 to 105 year timescale. The correlation is quite good but not perfect, indicating that other factors are at work as well, but then, we should hardly expect otherwise. If orbital variation were the controlling forcing today we would be sliding into an ice age.
Energy budget at the surface
Now it gets complicated. The key thing to remember is this: at equilibrium energy in = energy out. Change one part of that equation and the system will either warm (in > out) or cool (in <out), until equilibrium is reached again. There are two major issues here:</p>
- How much solar energy is reflected back into space
- How solar energy absorbed at the surface behaves
Albedo
The first of these is controlled by the reflectivity of the Earth, or its albedo. Specifically, our bond albedo is 0.29. Clearly if this changes, the amount of solar energy retained by the Earth also changes. If albedo increases, more solar energy is reflected out to space and the planet cools; similarly, if albedo decreases, more energy is retained in the Earth system and the planet warms.
Odd factoid: the surface of Venus gets less solar insolation than the surface of Earth. Its orbit is 72% that of Earth, so that at the top of the atmosphere it gets nearly twice as much sunlight per square meter as we do (light falls off as the square of the distance, so Venus gets (1/0.72)2 = 1.93 times what we do). However, the albedo of Venus is much higher than ours, though oddly enough that’s not a well-known figure, with most estimates ranging from 0.65 to 0.77. Let’s take the lower number, which means that 35% is absorbed. Then at the surface, they get (1.93)(0.35) = 0.675 of what we get at the top of our atmosphere, while we get (1)(0.71) = 0.71 of our TOA. The surface temperature is far hotter on Venus — 740K vs our 288K — not because it is closer to the sun, but because of a massive greenhouse effect.
Various surfaces have different albedos. Here’s a table from the Encyclopedia of Earth:

Variability in albedo is complex because albedo and the temperature response are not independent and feed back on each other. This is not the case for, say, orbital variability or changes in solar output. Probably the best known of these is the ice-albedo feedback: if global temperatures cool, ice sheets grow. As ice sheets grow, the planetary albedo increases, reflecting more solar energy out to space, lowering global temperatures. There have been times in Earth’s history when it is thought that ice sheets covered much of the world, and it is not entirely clear how we got out of snowball Earths (increased outgassing of CO2 plays a role, but evidence for releases of sufficient magnitude is thin). Conversely, a warming Earth leads to smaller ice sheets, which decreases albedo and causes the Earth to absorb more solar energy, further increasing the warming. The ice-albedo feedback is an example of a positive feedback loop (changes in one strengthen changes in the other in the same way). There needs to be something that triggers the feedback, however; in the past triggers include orbital variability, episodes of extended volcanism, changes in landmass location, and no doubt other things we don’t fully understand.
A warming world will lead to more evaporation and a higher absolute humidity (see here for a discussion of humidity scales), which may lead to more cloud formation. If it does, and the clouds are low clouds, planetary albedo may increase, which would tend to mitigate the temperature change, as low clouds have very high albedo (high clouds lead to net warming). This would be an example of a negative feedback loop — if warming actually leads to an increase in cloudiness.
Note that conversion of forest or grassland to agriculture or urban areas will also change albedo. So will moving landmasses around (landmasses over the poles tend to accumulate larger ice sheets).
Absorbed solar energy
Here we are interested in the solar energy that is not reflected out to space. What is not reflected is absorbed, and now it gets seriously complicated. Most of the energy radiated by the sun is in the visible (not surprisingly we are adapted to sense it well), a region of the electromagnetic spectrum to which the atmosphere is quite transparent.

Figure from here — the vertical scale is absorption of radiation. For reference, the visible spectrum ranges from about 0.4 microns (violet) to 0.76 microns or so (deep red). Anything shorter is ultraviolet, longer is infrared. The point is that most solar radiation makes it to the surface of the Earth, whereas a significant fraction of outgoing thermal radiation is absorbed in the atmosphere and converted to heat — this is the greenhouse effect. The absorption hole at ~10 microns is right at the peak of the planetary emission term and is known as the “atmospheric window”. If it weren’t, more energy would be trapped in the atmosphere and we would resemble Venus a bit more closely.
Here’s the energy budget of the surface-atmosphere system (figure from UCAR)

It’s a bit confusing, and the actual numbers shouldn’t be taken absolutely literally, so take it in pieces. The stuff in yellow on the left is “shortwave”, which is what comes from the Sun and is in the visible + UV + near infrared; the stuff in beige on the right is “longwave”, or what is reradiated out, and is deep in the infrared. First thing to note is that what goes in must come out. Of the 341.3 W/m2 incident, 102 are reflected, the remainder absorbed, either in the atmosphere or (mostly) at the surface (here they are apparently using 170.6 W/m2 mean insolation and a bond albedo of 0.299) The amount absorbed heats up the surface-atmosphere system, causing it to radiate that amount back to space. A fair amount of the incoming radiation is absorbed in the atmosphere, but nearly half is absorbed at the surface. The amount that does powers the great ocean currents, the ceaseless winds, hurricanes and tornados and blizzards, microscopic algae and giant sequoias, hummingbirds and blue whales and you and me.
The second thing to note is the amount exchanged between the surface and atmosphere. What is absorbed at the surface reradiates in the infrared; a fraction of this escapes out the atmospheric window, but most of it is absorbed in the atmosphere, primarily by water vapor, but also by CO2, methane, N2O, and other greenhouse gases. The atmosphere reradiates this absorbed energy (as well as the amount absorbed from incoming radiation), some out to space, some back to Earth, which reradiates back out to the atmosphere, etc etc … this is why the gross heat flux out of the surface is greater than the absorbed shortwave.
Change
Nothing is ever static of course, and changes to the energy budget will either cause global warming or cooling. If the global temperature is changing, there is a net heat imbalance in the energy budget. In the figure above, Kiehl and Trenberth estimate a net absorption of 0.9 W/m2: because we are retaining more energy in the atmosphere, energy in > energy out, and we have global warming.
The primary ways to change the budget are either through albedo, as mentioned above, or by trapping more or less solar radiation in the surface-atmosphere system. This latter is done primarily by changing the concentration of greenhouse gases. Nothing is ever easy of course: the primary greenhouse gas is water vapor, but you cannot simply add or subtract water vapor — its concentration depends on temperature and reequilibrates more quickly than changes in temperature. Increase or decrease temperature some other way — by CO2 or methane, perhaps — and water vapor will respond by amplifying the change. These and other feedback loops, some of which are positive (amplify change), some negative (mitigate change) couple to each other along a huge range of timescales and also couple to albedo, often indirectly, making for a very complex system. Here’s a plot taken from the IPCC’s AR4 summarizing changes to the energy budget (again, don’t take the numbers too literally):

Note that changes to albedo and energy retained (primarily by GHG) contribute in opposite directions, but the GHG term dominates and the net effect is warming: compare the CO2 trend with the temperature record and solar insolation figures above (figure taken from Keeling et al 2007)

The correlation is not perfect, but then we should hardly expect it to be: many things are happening at the same time. Even so, the GHG trend is the only factor changing with sufficient magnitude on the observed timescale to explain the bulk of the global temperature trend.
Standard caveat applies: you cannot infer causation from correlation. Well correlated observations may have a causal link — or they may all be responding to a forcing you haven’t identified. Or they may not be related at all. You need a mechanism in your model. If your model results correlate well with reality, you gain some confidence that you got something right. If they correlate well over a wide scale of conditions and timescales, you are probably on to something. Science doesn’t do proofs, so this is as good as it gets. But if your results do not correlate well with reality, you screwed up somewhere. So correlations are important — you just can’t infer causation from them.
A couple of final thoughts. Pretty much everything is driven by the Sun. Without that this would be a dead, cold planet. But we need to distinguish the actual energy budget from variability in that budget. One controls climate, the other climate change. Also, timescale is important. Orbital variations are much too slow to show up on the ~century timescale of the AR4 plot, but changes on that timescale to solar output do, and there is a small warming term from solar variability. All of the factors affecting the energy budget are constantly changing, of course, and all of these factors contribute, but some are more important at one time or another, on one timescale or another, than others. In our time, on our timescale, the primary — but not only — driver is change in greenhouse gas concentrations.